

IDENTITY
THREAT
REPORT
- THE LANDSCAPE ATTACKERS ARE EXPLORING TODAY
1+ TRILLION
recaptured identity assets
65.7 BILLION
17+ BILLION
63+ MILLION
Mapping the new identity terrain
Identity exposure is measurable and fixable – yet most organizations are still navigating with an outdated map, drawn for marked trails rather than the backcountry attackers now roam.
The terrain has expanded past employee credentials to session tokens, non-human identities, and third-party ecosystems, and closing the gap means surveying what’s exposed beyond the camp’s edge before attackers get there first.
This year’s Identity Threat Report [1] – a survey of security leaders and practitioners across North America, UK and select European Markets – benchmarks how enterprise organizations detect, remediate, and govern identity threats – and what separates the most mature programs from the rest.
Table of Contents
Key takeaways
Insights and highlights from 750+ security respondents. Dig in by expanding each section.
01 Identity-based events are now a routine reality
More than two-thirds (68%) of organizations experienced an identity-based event in the past year, with affected organizations averaging eight events – confirming that identity compromise has become an operational reality rather than an isolated incident.
experienced an identity-based event
02 Non-human identities (NHIs) are now the leading route for initial access
NHI-related misuse or compromise was the top reported identity-based event type (42%), while exposed or overprivileged NHIs were cited by 50% as a common access path for attackers launching identity-based events.
50% Most common path
03 Visibility gaps leave critical markers unseen
Organizations that experienced identity events were significantly less likely to have visibility into stolen session cookies (37% vs. 50%) and personal devices (40% vs. 52%), suggesting that blind spots continue to fuel successful attacks.
04 The AI governance map has not kept pace
91% of organizations use AI tools or agents with internal access, but only 56% have formal governance and ownership for AI- and NHI-related privileges.
05 Overconfidence can hide the biggest blind spots
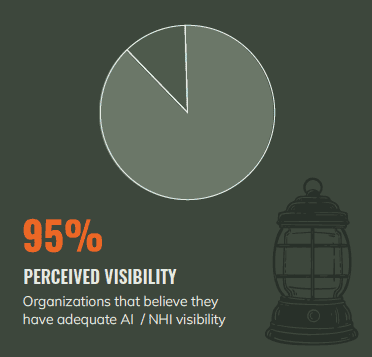
C-suite leaders were far more confident in their NHI visibility than frontline operators (66% vs. 50%). While the U.S. and Canada largely tracked the global baseline, the UK reported the highest confidence (53%) despite experiencing the highest identity event rate (77%) – demonstrating that confidence does not necessarily reflect coverage.
06 Industry differences reveal different frequency and impact of identity events
Government sector reported experiencing a much higher frequency of identity events (92.3% vs. 68% total), and government orgs reported the highest average event volume (10 events vs. 8 total average).
Manufacturing organizations, on the other hand, were significantly less likely to have experienced an identity-based event (58% vs. 68% total), but when they did, the fallout was worse, reporting customer or partner trust loss as a business impact (56.9% vs. 40.2% total) and higher average impacts across the board – a classic “fewer, but costlier” pattern.
07 The trail extends beyond organizational boundaries
Third-party malware infections (23%) and API key/application exposures (22%) were cited as the leading causes of supply chain identity events across respondents.
Vendor remediation validation is uneven, even across technology-heavy sectors. Telecommunications leads with the highest active validation rate at 68%, while Technology / Software organizations report the lowest rate at 38%, revealing meaningful differences in third-party identity governance.
08 The best organizations prove what's possible
Germany emerged as a benchmark for third-party identity governance, with 76% of organizations actively confirming vendor remediation, demonstrating that stronger operational practices can substantially improve supply chain visibility.
09 Scale influences confidence, but not certainty
Large enterprises (5,000+ employees) reported significantly higher confidence in their identity visibility than mid-market organizations, but confidence alone did not consistently translate into better outcomes.
10 Manual remediation creates costly detours
Organizations relying on manual remediation reported higher incident response costs (39%) and customer trust loss (47%) compared to their peers who report using high levels of automation (32% and 36%, respectively).
Mapping the path to operational maturity
The data in this year’s report suggests that operational maturity is more closely associated with resilience than company size, industry, or geography. Organizations with more mature identity threat protection programs report lower identity-based event rates and stronger visibility, monitoring, remediation, governance, and automation practices.
The Identity Threat Protection Maturity Trail
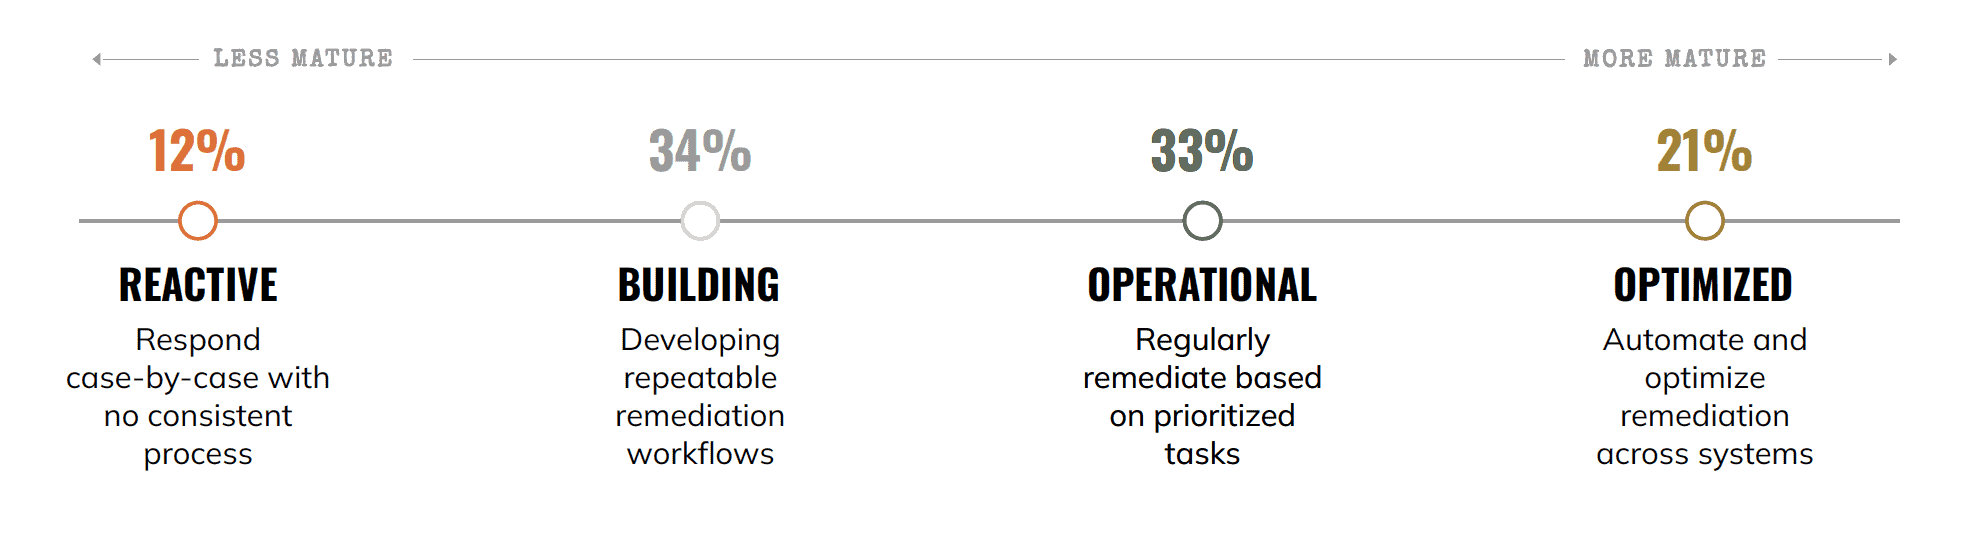
To benchmark organizational readiness, respondents were grouped into four maturity tiers: Reactive, Building, Operational, and Optimized based on their identity exposure across visibility, monitoring, governance, automation, and remediation capabilities.

Reactive
Limited visibility, manual processes, and
inconsistent remediation
9%
BUILDING
37%
OPERATIONAL
45%
Optimized
45%
Identity-based event rates by maturity tier
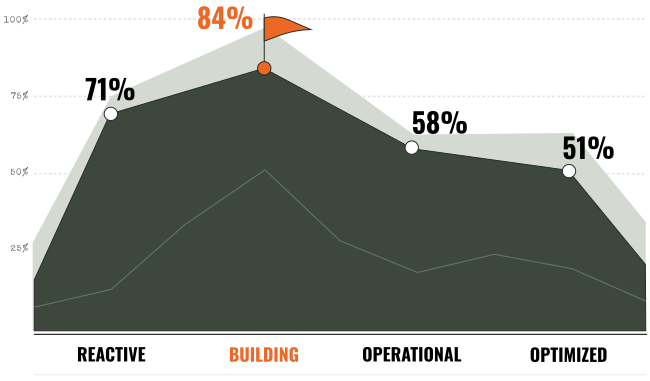
Organizations in the Building tier experience the highest incident rate, likely reflecting greater visibility into identity exposures before mature processes and automation begin reducing risk. From there, the data shows a clear maturity effect: identity-based event rates decline substantially as organizations move from Building ultimately up to Optimized.
Confidence vs. identity-based event rate by market
Across the regional segments, organizations report relatively high confidence in their visibility, yet identity-based events remain common. The disconnect is most pronounced in the United Kingdom, which reports both the highest visibility confidence (53.3%) and the highest identity-based event rate (76.7%), reinforcing a central finding of this report: confidence does not equal coverage.
Attackers exploit what organizations can't see
Organizations that avoided identity-based events consistently monitored more exposure types than those that experienced incidents.
Visibility into two areas stood out most in affecting whether an organization experienced identity-based events:
Stolen session cookies
PERSONAL DEVICES WITH CORPORATE ACCESS
Phishing and malware remain persistent access paths
Phishing and malware continue to create boundless opportunities for bad actors, providing them with stolen session cookies, credentials, refresh tokens, and more to carry out session hijacking, ransomware, account takeover, and other attacks.
VISIBILITY ON PHISHING EVENTS
The attack map extends beyond the perimeter
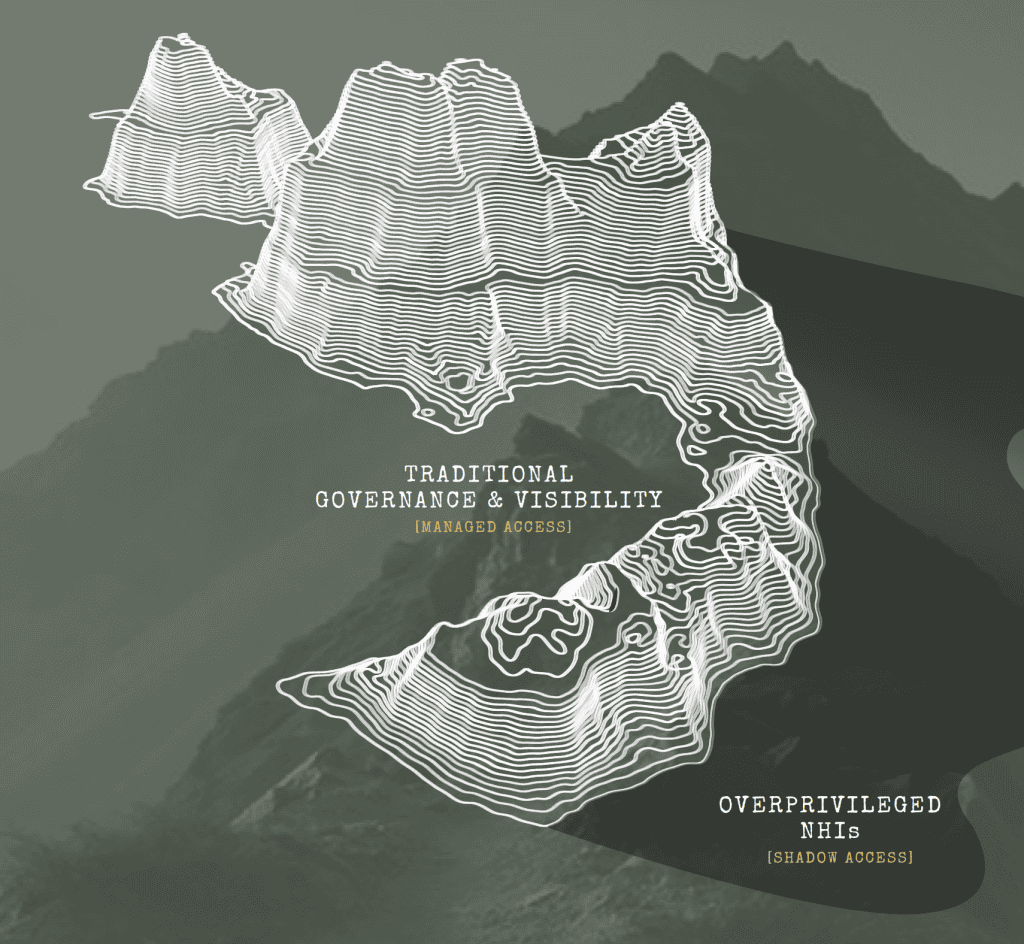
AI tools, agents, applications, vendors, and partners are creating new identity paths into the business. As these connections expand, identity risk increasingly comes from privileged access that sits outside traditional governance and visibility.
Nearly every organization surveryed (91%) now uses AI tools or agents with access to internal systems, applications, or data. Yet only 56% have formal policy and clear ownership for managing AI- and NHI-related privileges. Another 41% rely on informal processes or partial ownership.
NHIs are now the leading route for initial access
The visibility gap has real consequences. NHI-related misuse was the most commonly reported identity-based event (42%). Meanwhile, 50% of affected organizations cited exposed, compromised, or overprivileged NHIs, including API keys, tokens, and service accounts, as common access paths, and 31% identified them as the single most common initial access vector.
Governance helps bring the trail into view
Formal governance doesn’t just assign ownership. It improves visibility across the broader identity ecosystem.
For example, 49% of organizations with formal AI governance have visibility into personal devices with corporate access, compared with 36% of organizations relying on informal governance.
The malware-to-supply-chain pipeline
Many supply chain identity incidents begin with common exposure-hygiene failures rather than sophisticated attacks.
Despite the clear benefits of automation, most organizations remain in a transitional phase. While relatively few still rely entirely on manual processes, only about one in five have reached fully optimized remediation and investigation capabilities.
23%
cite malware-infected third-party devices
as the leading cause of supply chain identity incidents
22%
CITE EXPOSED API KEYS OR APP ACCESS
Identity Exposure Remediation Maturity
Fully automated remediation remains rare until organizations reach the Optimized tier. The sharp increase from 24% of Operational organizations to 81% of Optimized organizations highlights automation as one of the defining capabilities that separates trail leaders from the rest of the market.
Charting The Path Forward
Identity exposure can’t be addressed through a single technology, process, or policy. The strongest programs build operational maturity over time, strengthening visibility, accelerating remediation, and validating outcomes across an expanding identity ecosystem.
Top planned investments over the next 12–18 months:
The organizations making the greatest progress focus on three operational priorities.
Fully automated remediation remains rare until organizations reach the most mature, Optimized tier. The sharp increase from Operational organizations (24%) to Optimized organizations (81%) highlights automation as one of the defining capabilities that separates trail leaders from the rest of the market.
Get the full picture:
Expand visibility beyond the perimeter
Leading organizations continuously monitor identity exposure across employees, vendors, any and all devices accessing work applications, session cookies and tokens, AI tools, and NHIs.
SHORTEN THE TRAIL:
AUTOMATE RESPONSE & REMEDIATION
Visibility without action creates more alerts, not better outcomes. Trail leaders reduce exposure faster through automated investigation, remediation, and validation workflows, reducing the time attackers have to exploit exposed identities.
Key capabilities include:
- Credential rotation
- Session and token revocation
- Privilege reduction
- Automated response orchestration
Close the loop:
Verify vendor remediation
Nearly 40% of organizations lack a consistent process to verify vendor remediation, leaving them vulnerable to unresolved identity exposures across third-party ecosystems.
Verifying remediation closes the loop between detection and response, helping make sure identity threats are actually eliminated rather than simply identified.
The Journey Ahead
No organization ever reaches a final, fixed vantage point – the terrain keeps shifting as new trails open and old ones erode. What separates the organizations ahead of the pack isn’t a completed map, but a commitment to resurveying it: watching for new routes attackers carve out, marking blind spots as they’re found, and moving with the confidence that comes from knowing the ground beneath you rather than assuming it. Identity threat protection isn’t a summit to reach – it’s a trail maintained one season at a time.
METHODOLOGY
This report is based on a survey of 750 cybersecurity decision-makers and practitioners conducted in June 2026. Results are reported at a 95% confidence level with a ±3.58% margin of error.
RESPONDENTS
Security architect or engineer: 23% · Identity and access management (IAM) director, manager,
or specialist: 22% · Security director, manager, or team lead: 20% · CIO, CISO, or IT security
executive: 19% · Security operator, analyst, or incident responder: 11% · Security
administrator: 3% · Other role in IT security: 2%
02
Company Size
1,000–4,999 employees: 42% · 5,000–9,999 employees: 29% · 500–999 employees: 19% ·
10,000–25,000 employees: 8% · More than 25,000 employees: 1%
03
GEOGRAPHY
United States: 26.5% · Canada: 20.1% · United Kingdom: 20.0% · Spain: 6.7% ·
Germany: 6.7% · The Netherlands: 6.7% · Austria: 6.7% · Switzerland: 6.7%
04
INDUSTRIES
Manufacturing: 13% · Healthcare: 12% · Energy, Extraction and Utilities: 11% · Insurance: 11% ·
Retail & Ecommerce: 11% · Financial Services / Banking: 10% · Professional Services: 8% ·
Technology / Software: 8% · Telecommunications: 5% · Education: 4% ·
Government – Federal: 3% · Government – State/Local: 2% · Travel & Hospitality: 2%